CO State Hwy 9 Project – Year 4 Progress Report
From the initiation of the CO State Highway 9 Safety Project in 2011, to its approval for funding in 2013, to the project’s final completion in late 2016, a comprehensive monitoring program has tracked wildlife responses and vehicle collisions from start to finish. This past summer, the release of the year-4 monitoring report presented the results of post-construction monitoring from December of 2015 through April of 2019. Participating in the study were researchers and scientists from CO Parks & Wildlife (CPW), CO Department of Transportation (CDOT), US Fish and Wildlife (USFWS), and ECO-Resolutions.
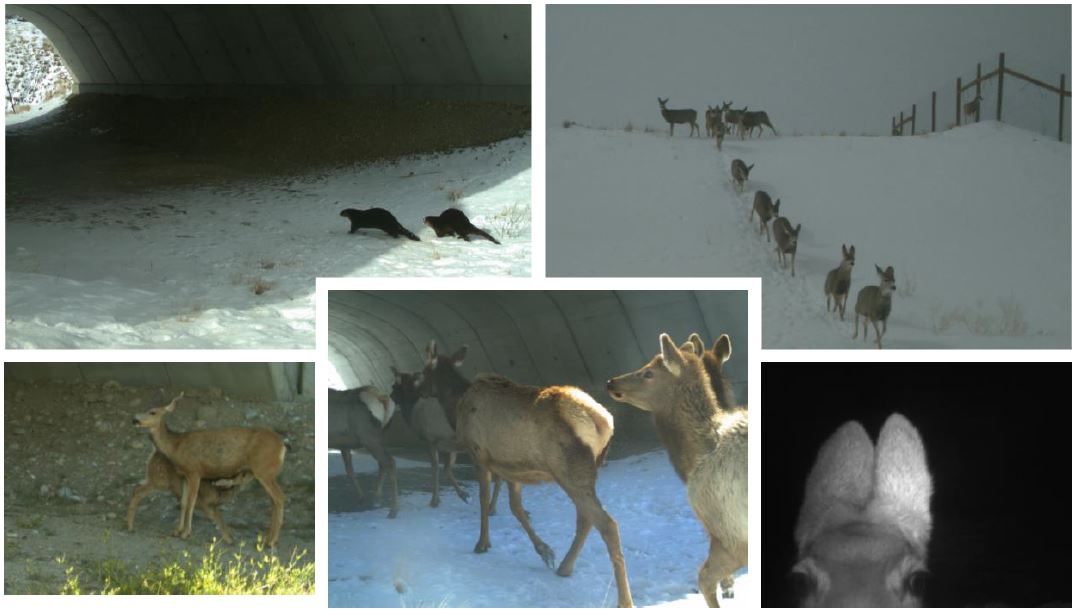
Researchers used 62 motion-triggered cameras at 49 locations to record animal movements and behavioral responses to the wildlife mitigation structures, which include 5 wildlife underpasses, two wildlife overpasses, wildlife guards, wildlife fencing and escape ramps. The findings of the report continue to be encouraging, including these highlights:
- The successful movements of mule deer over or under the wildlife crossings has increased each winter (see Figure E-1 below), with a total of 83,256 successful movements over the study-period. Overall, the mule deer success rate has been 96%, with an average of 168 successful movements through the 7 crossing structures daily. This indicates that the mitigation has been highly effective in increasing mule deer connectivity across Highway 9, and the use of both underpasses and overpasses suggests that landscape factors (like winter range distribution) may play a bigger role in influencing crossing use than the type of structure.
- In addition to mule deer, cameras have captured many species using the structures, including large and medium-sized animals like elk, white-tailed deer, pronghorn, black bear, bobcat, coyote, mountain lion, bighorn sheep, and moose (Figure 18 on page 32 of the report), as well as smaller animals such as red fox, badger, hare, skunk, otter, turkey and raccoon (Figure 20 on page 35 of the report). The data are beginning to show differences in crossing preference among some wildlife species, especially carnivores.
- Wildlife-vehicle collisions have decreased markedly, down 88% relative to the pre-construction average, with carcass counts decreasing 90%. As more data are analyzed, the numbers suggest that as many as 170 wildlife-vehicle collisions have been prevented in the three years since completion of the project.
- The study also found that round bar wildlife guards were more successful in repelling mule deer from entering the fenced road corridor (90% repel rate) compared to flat bar wildlife guards (80% repel rate).
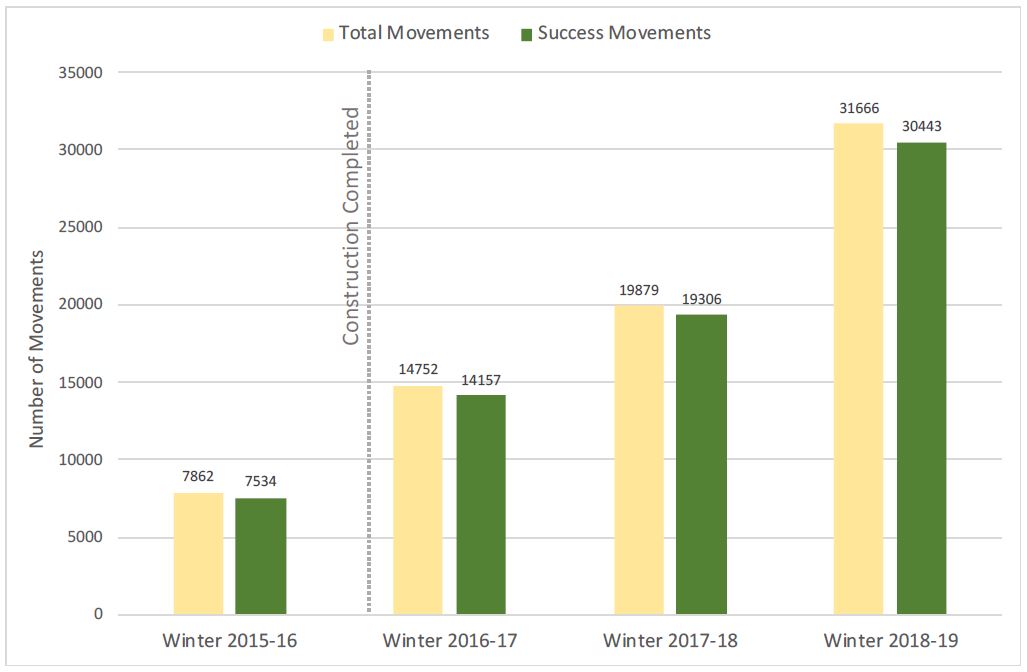
Figure E-1 from the Progress Report illustrates how many successful movements vs total movements by mule deer at crossing structures for each of the 4 winter seasons covered by the study.
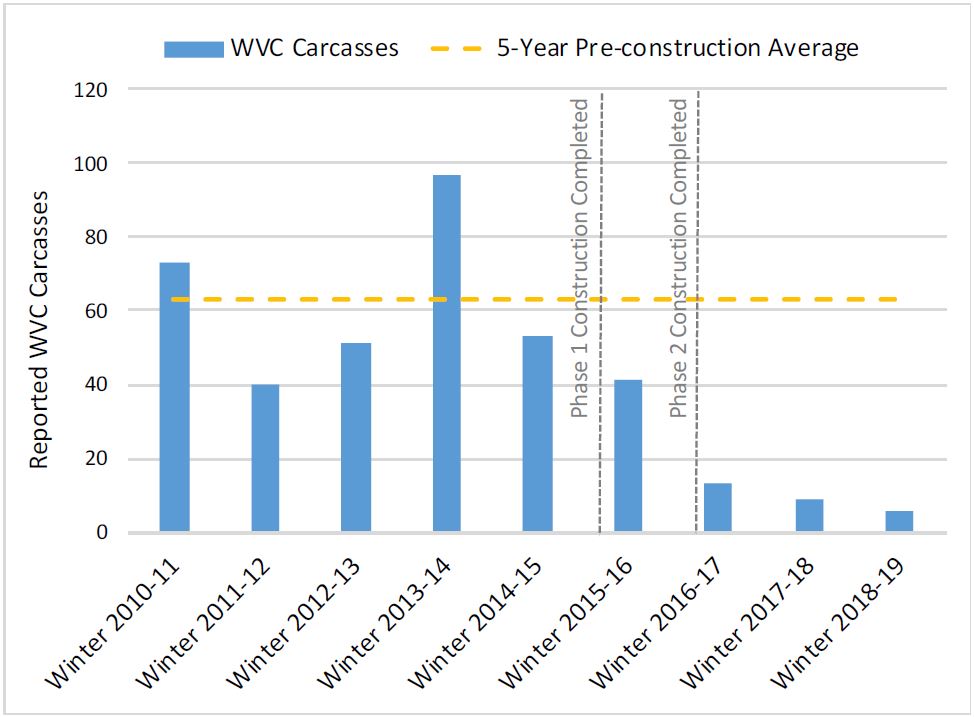
Figure E-2 from the Progress Report shows mule deer and elk carcass counts recorded by Blue Valley Ranch and CO Parks & Wildlife compared to the 5-yr pre-construction average of 62.8 carcasses per year.
Researchers will continue to work with CDOT and CPW to monitor and evaluate the project through April of 2020. So far, the Project has met or exceeded all expectations for reducing wildlife-vehicle collisions and encouraging wildlife to use the crossing structures. The data from the monitoring program through the final year of data gathering will be critically important for a final analysis of the project’s success, and will be used to inform future wildlife-highway mitigation projects across Colorado and the West.
State Highway 9 Wildlife Crossings Monitoring Reports
2017 – Phase 1 Monitoring Report (December 2015 – March 2016)
2018 – Year 2 Monitoring Report (December 2015 – April 2017)
2019 – Year 3 Monitoring Report (December 2015 – April 2018)
2020 – Year 4 Monitoring Report (December 2015 – April 2019)
Tags: big game, elk, Habitat, Highway 9, landscapes, monitoring, moose, mule deer, overpass, predators, ranching, wildlife